


The Pi Studio Workflow
Pi Studio helps you create, edit, and test rubrics efficiently through an iterative process.
1. Uploading Sources
First, upload relevant data files called sources. Sources are your application’s data used to generate and evaluate your rubric. You can upload multiple sources of different types to provide a comprehensive view of your application. Requirements Sources
Product requirements documents, user stories, or other documents describing your application’s desired functionality. You can also upload existing rubrics to load them into the studio or use as seeds for generating improved rubrics.
Let’s say you’re building a chatbot which answers questions about legal documents. You might upload a requirements document outlining the functionality of the chatbot, like a Product Requirements Document (PRD) or system prompt.
If you want to import a rubric from Google Sheets, you can export it as a CSV file and upload it here or copy and paste it directly.
Unlabeled Data Sources
Examples of inputs and outputs from your application. Unlabeled data provides context for what your application does and the types of data it deals with, but does not provide ground truth quality labels.
Rated Data Sources
Datasets labeled by users or subject matter experts. Each item is labeled as being of good or bad quality. If the label is binary, i.e. either good or bad but nowhere in between, the label will be taken directly. If the label is a score, e.g., 1-5 stars, the score will be binarized to good or bad.
Rated data provides absolute ground truth for your application’s quality—whether an item is good or bad on its own. Using rated data, your rubric can learn what qualities make an item good or bad.
With our legal document example, you might upload a dataset of chatbot responses rated by users as helpful or unhelpful. Your rubric will learn which qualities your users are looking for in a helpful response.
Preference Data Sources
Datasets of item pairs, where one item is “chosen” and the other is “rejected”. Typically, each row of such a dataset contains three columns: the input to the application, the chosen output, and the rejected output.
Preference data provides relative ground truth for your application’s quality—whether one item is better than another. While rated data gives an absolute measure of quality, preference data can help your rubric learn more specific, nuanced distinctions between items.
For our legal document chatbot, you might upload a dataset of pairs of chatbot responses where one was selected as better than the other by a user or subject matter expert.
Train-test splits
It is good practice to split your labeled data, i.e. rated and preference data, into separate training and testing sets. This allows you to generate and tune your rubric on the training set while evaluating its performance on the unseen test set, helping to ensure that your rubric generalizes well to new data. You can open any labeled data source and split it into training and testing sets using the Split into sets button in the source view.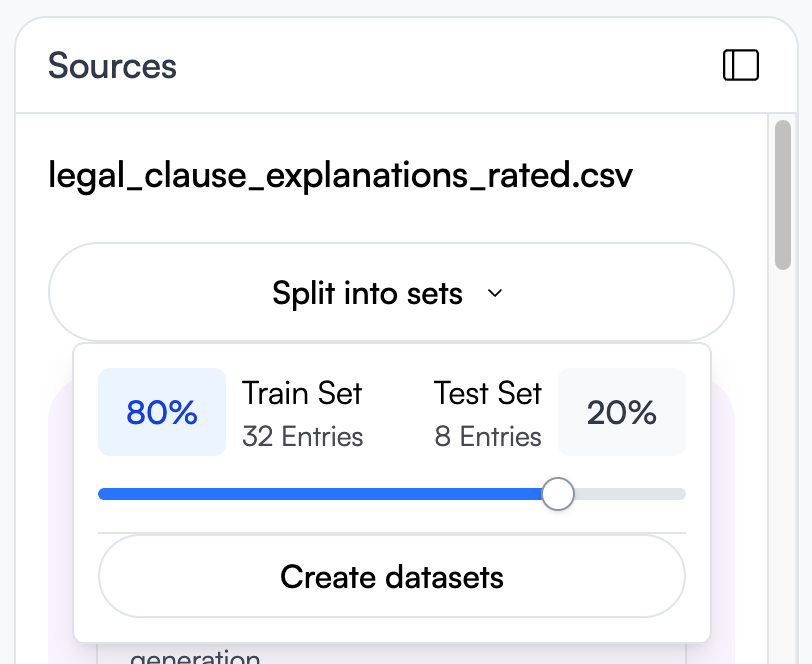
2. Generating Rubrics
Select the sources you want to train on and click Judge > Generate new version. Pi Studio will use your selected sources to generate a rubric. Rubric generation aligns the rubric to your labeled data sources by choosing criteria and a threshold for the total score which prove effective at classifying your labeled data. For rated data, alignment is based on the absolute quality labels. For preference data, alignment is based on whether the chosen item scores higher than the rejected item. Rubric generation is a long-running operation on the order of 2-10 minutes, as it explores a multitude of possible combinations of criteria to fit your labeled data; you can close the tab and return later to check progress. After rubric generation completes, click Load into Studio to start working with the generated rubric.3. Generating Performance Reports
Once you’ve generated a rubric, you can generate performance reports to evaluate how well your rubric aligns with your application’s quality requirements. There are three types of reports you can generate: evaluation reports, alignment reports, and criteria health reports. Each report provides different insights into your rubric’s performance. Evaluation Report
Scores items from the selected sources with the current rubric.
The report provides:
- The average total score across all items
- A histogram showing the distribution of total scores showing low vs. high quality items
- A table showing the full set of scored items
Alignment Report
Computes how aligned your rubric is with the selected rated and preference data sources.
Recall that along with the generated rubric, rubric generation produces a recommended threshold for the total score which aligns with labeled training data. The rubric aligns with rated data if the thresholded total score matches the good/bad label. The rubric aligns with preference data if the chosen item scores higher than the rejected item.
The report provides:
- An alignment score between 0 and 100 which indicates the proportion of items correctly classified as good or bad quality
- A confusion matrix which shows the correct and incorrect classifications
- The Align in Copilot button, which asks the assistant to search your unlabeled data sources for items that would help your rubric generalize better.
Dimension Health Report
Evaluates how well each question discriminates between good and bad quality examples by generating items of varying quality and scoring them with the current rubric.
The report provides:
- A health score indicating the ratio of healthy to total dimensions, e.g., 3/5 for 3 healthy out of 5 total questions
- Box plots showing the distribution of scores for each criterion across generated items of varying quality
- The dimension calibrator: a tool to review question performance, edit unhealthy questions, and modify test variants
Iterating Towards Alignment
Uploading sources, generating rubrics, and generating reports form a feedback loop:- By uploading sources, you can give context for your application requirements and representative samples of their application data.
- Through generating rubrics with sources, you receive interpretable, reliable metrics which are based in your ground truth data rather than assumptions or heuristics.
- By producing reports, you can evaluate how well your rubric generalizes to and aligns with your test sources, revealing weaknesses in the rubric which can be addressed by uploading new sources and generating a new version of the rubric.
The Copilot
The Pi Studio Copilot is an AI assistant that helps you throughout the rubric creation and tuning process. You can chat with the Copilot in the middle pane. You can ask the Copilot questions about your sources, rubrics, and reports. Given its ability to process large amounts of text, the Copilot can be very useful for searching through your sources and drawing insights from your reports.Rating Data
Sometimes, you may have a large amount of unlabeled data but not enough labeled data to generate a well-aligned rubric. The Copilot can help you label your data by presenting you with unlabeled data items to rate. Click the Find Unlabeled Data to Rate button in the Copilot pane. The Copilot will search your unlabeled data sources for items that would be most informative for your rubric and present them to you as a set.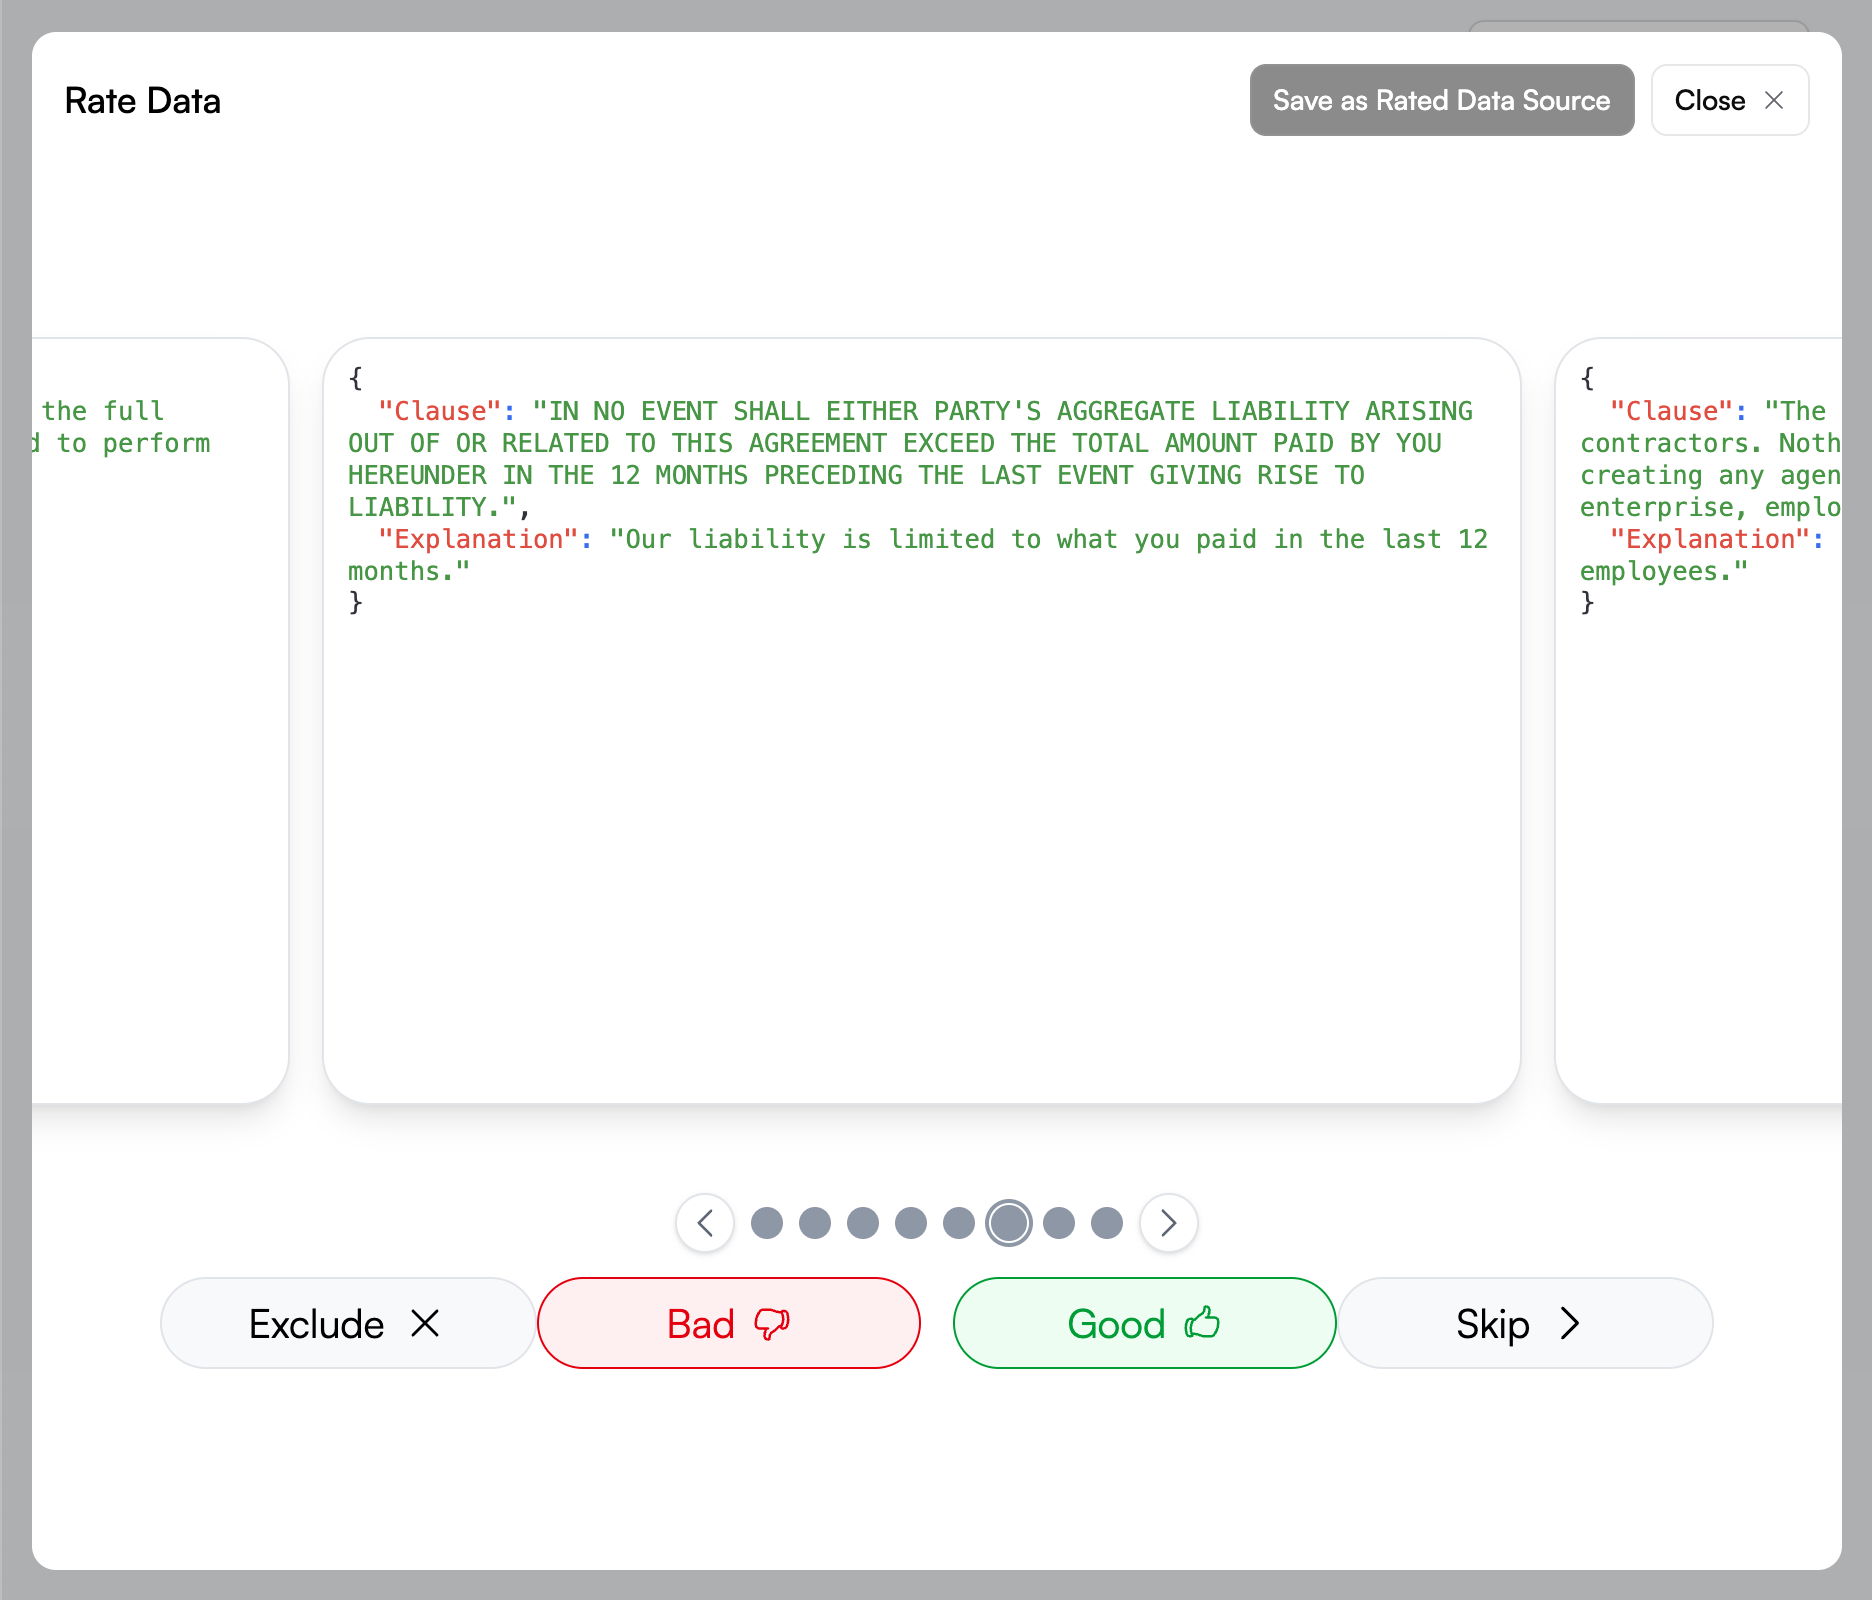
Using Your Rubric
When you’re ready to use your rubric, you have several options for exporting and integrating it into your workflow.Export Your Rubric
Open your rubric and click Code to see a code snippet demonstrating how to call Pi Scorer with your rubric.Explore Integrations
Use your rubric with third-party tools through Pi Labs integrations. Click Integrations in your rubric to see available options:
Google Sheets
Export your rubric and sources to Google Sheets using our official Sheets add-on

Promptfoo
Build evaluations with natural language questions as evaluation criteria

Unsloth
Use your rubric as a reward function for fine-tuning large language models

Langfuse
Monitor and evaluate AI applications in production

Braintrust
Monitor and evaluate AI applications in production

Langsmith
Monitor and evaluate AI applications in production

Arize Phoenix
Monitor and evaluate AI applications in production